I have written a lot about risk over the years and how it can influence portfolio management and market participant behavior. For example, in 2022 many investors feared the developing market weakness and they “ran for the hills” by selling equities and buying bank CDs; thus, locking in losses and missing the huge recovery and new all-time highs in the broad equity markets.
Managing risk through portfolio management is as much an art as it is a science. For a globally diversified portfolio and a given set of constraints, there are numerous approaches we could follow and many analytical tools (such as Portfolio Visualizer) we can use to help guide us with this task. Let’s look at a few strategies that we could employ for a typical client.
Let’s assume you are a client with a long-term time horizon to retirement and want to maximize return as an aggressive investor with the capacity to accept a large amount of risk (20% standard deviation of returns). Intuitively, we can guess that the target aggressive portfolio would be heavily weighted to equities with no fixed income allocation. But, what exactly would this portfolio look like and what does the 20% standard deviation of return translate to?
Using the Portfolio Visualizer model, we can model expected results and get an idea of the details underlying these assumptions. As you would expect, this aggressive model portfolio would generate large losses when the equity markets go down with a maximum drawdown of -30.16% but would generate a modeled expected return of +13.63% over a 10-year horizon (See table/chart below). This portfolio targets the most aggressive sectors of the equity markets and is minimally diversified to help maximize returns; something a typical investor might not be comfortable with.
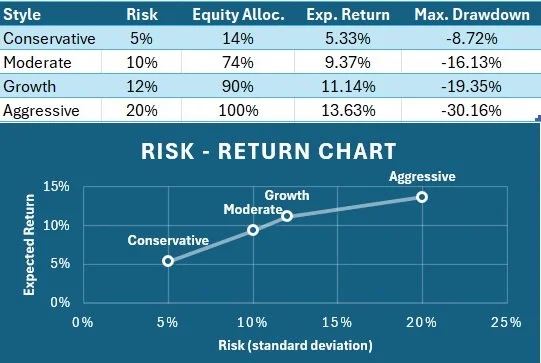
Let’s say, however, that you are a bit risk-averse and instead want to target a lower moderate risk portfolio with a 10% standard deviation of return. In that case, your fixed income allocation goes up from 0% to 26% and your maximum drawdown goes to only -16.13% with a modeled expected return of +9.37%. Interestingly, this modeled portfolio maintains a relatively large equity weighting, but this time it is allocated to the least risky equity sectors.
If you are somewhere in the middle, we can target a 12% risk and target a growth portfolio that results in a 10% fixed income allocation that generates a modeled return of +11.14%. Again, this modeled portfolio targets the least risky equity sectors in lieu of a larger fixed income allocation to help reduce portfolio risk.
So, what does this all mean? Models, after all, are only “models” and can only be used as a guide. Quant investors, meaning those asset managers who rely on quantitative models to manage their portfolio, do NOT beat the market with any regularity over time so we know that models alone are NOT the solution.
There are literally an infinite number of combinations of equities and fixed income to create a portfolio with similar levels of risk, so SOMEONE needs to make an investment decision and invest in SOMETHING! That is my job, as an investment adviser, to use my experience and knowledge of the markets to understand client objectives and goals to create an appropriate diversified portfolio with a target level of risk.