Gold is an interesting asset class. At its most basic level, it is a metal like any other metal with commercial uses for jewelry and industry. However, that is where the basic story ends with gold historically elevated to the status of “store of wealth”. Is gold a good investment? Should we all hold some gold in our portfolios?
There are a few ways to look at gold from an investment perspective. No doubt, from a total return perspective gold (GLD) performed exceptionally well in 2025 with a +63.7% return compared to the S&P 500 (IVV) at +17.8% (see chart below).
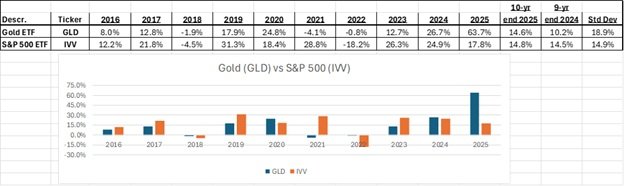
With that return, however, comes risk. The standard deviation of return for gold over the past 10 years is 18.9% compared to 14.9% for the S&P 500. This means that gold will statistically have a higher probability of having its return vary by 4% more compared to the volatility of the S&P 500 in any given year. Additionally, the outsized outperformance of gold in 2025 largely distorts its long term performance since excluding 2025 from the 10-year horizon lowers its return from +14.6% to 10.2% compared to +14.8% to 14.5% for the S&P 500.
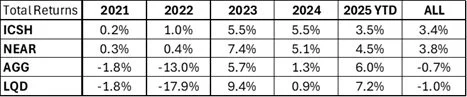
The “silver-lining” here, though, is the historical correlation coefficient of gold compared to the S&P 500 and other asset classes. Core bonds are considered a good portfolio risk diversifier since its return profile is different than equities; its return “zigs” when other markets “zag”! However, as good as core bonds may be in that regard, gold is even better with a very low correlation coefficient to most other asset classes.
Market panics and geopolitical turmoil typically drives the price of gold up as behavioral bias drives people to a store of wealth that is thought to be irrefutable and manipulation-resistant. This thesis might be flawed, however, since audits of government holdings in gold have been questioned recently. Also, gold is often thought to be a good inflation hedge, but its performance in the major inflation spike in 2022 was uninspiring with “negative” returns during that time horizon!
In practice, we think of gold as a specialized diversifier rather than a portfolio stabilizer. While it can provide diversification benefits in certain environments, it also comes with higher volatility and can add risk over shorter and intermediate time horizons. Gold does not reliably compound wealth over time, and its performance is often driven by macro and behavioral forces that are difficult to anticipate in advance.
Given gold’s exceptional run in 2025, we are not inclined to add new exposure at current levels, as large short-term gains often make the forward-looking risk/reward profile less favorable. From a disciplined portfolio standpoint, we prefer to avoid allocations driven by recent performance and instead focus on opportunities with stronger long-term compounding potential.